Common Types of Infographics and When to Use Them
Creative & Digital, Guides / July 26, 2022
By Bob Prow
This article was updated in July 2021.
Infographics and data visualization are a great way to promote and prove thought leadership about your products, services, processes, or brand. Both also aid your brand awareness, marketing and business development.
In this article, we will discuss the significance of data visualization. We will also explain why infographics are effective and explore ten of the most common types of infographics. Additionally, we will provide advice on when and why to use them.
Why are infographics so effective?
Well-crafted infographics can make your data memorable and understandable in a way that few other forms of media can. They communicate and visualize complex ideas and data into digestible, and easier-to-understand visuals.
Infographics can be powerful tools for displaying data, explaining concepts, simplifying presentations, mapping relationships, showing trends, and providing essential insights.
They also help convey and visualize data in a compact and shareable form. By repurposing them – often into smaller segments – they can be shared across multiple marketing channels. This can result in additional exposure and awareness. This has become even more important as our attention spans have grown progressively shorter, thanks to smartphones.
DID YOU KNOW
Data creation and consumption soar
The volume of data created, consumed, and stored is growing dramatically. According to Statista, worldwide data volume will increase nearly 300%, from 64.2 zettabytes in 2020 to more than 181 zettabytes in 2025. In fact, between 2019 and 2021 data volume nearly doubled. One reason was “due to the COVID-19 pandemic, as more people worked and learned from home.”
Why do infographics work?
There is a great deal of research on how quickly your brain absorbs visual content over text. They following examples are the most compelling:
- From a recent Forbes article, “because 90% of information transmitted to the brain is visual according to this report, and visuals are known to improve learning and retention by 400%.”
- Visual content really does work because our brains process visuals 60,000 times faster than text.
- According to Search Engine Journal, infographics are 30 times more likely to be read than text.
What’s the takeaway: we may forget what we’ve read, but remember what we’ve seen.
10 types of infographic examples and advice on when to use them
Infographics come in various forms. To help you identify the infographic that will best serve your purpose and audience, we’ve categorized infographics from our portfolio.
They are categorized based on purpose, content type, and the flow of information. We also provide examples of each and advice on when to use them.
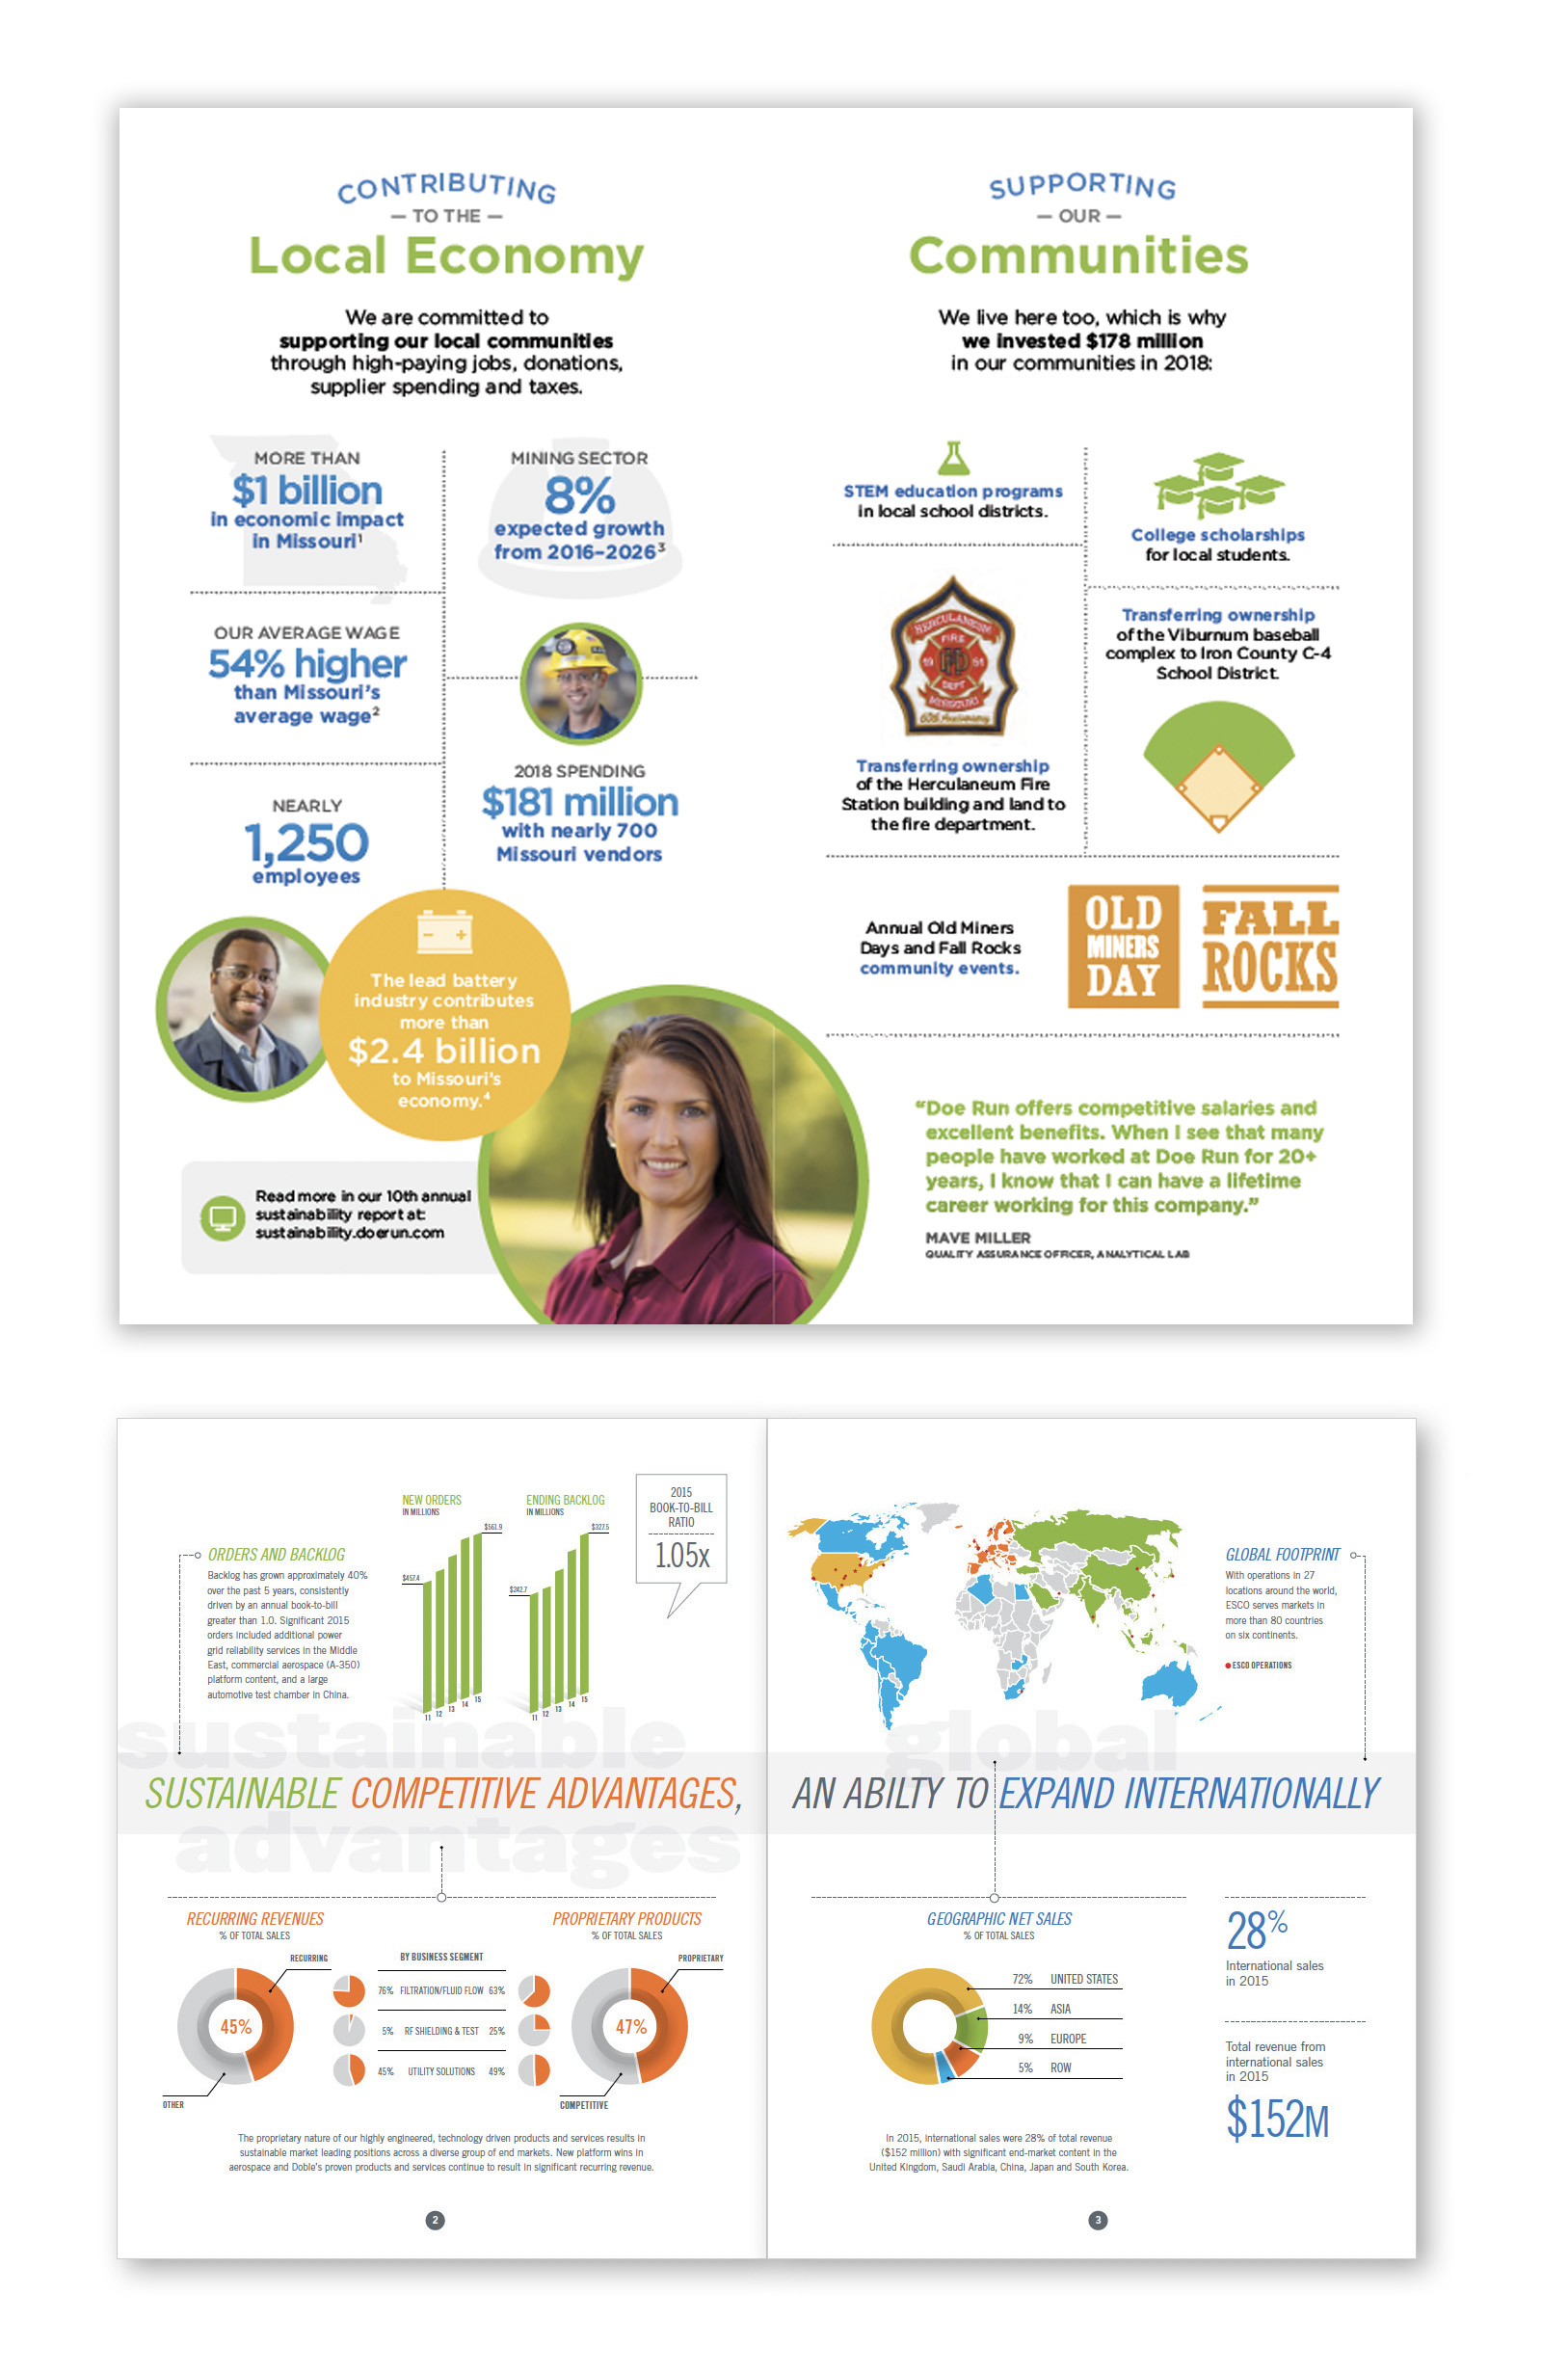
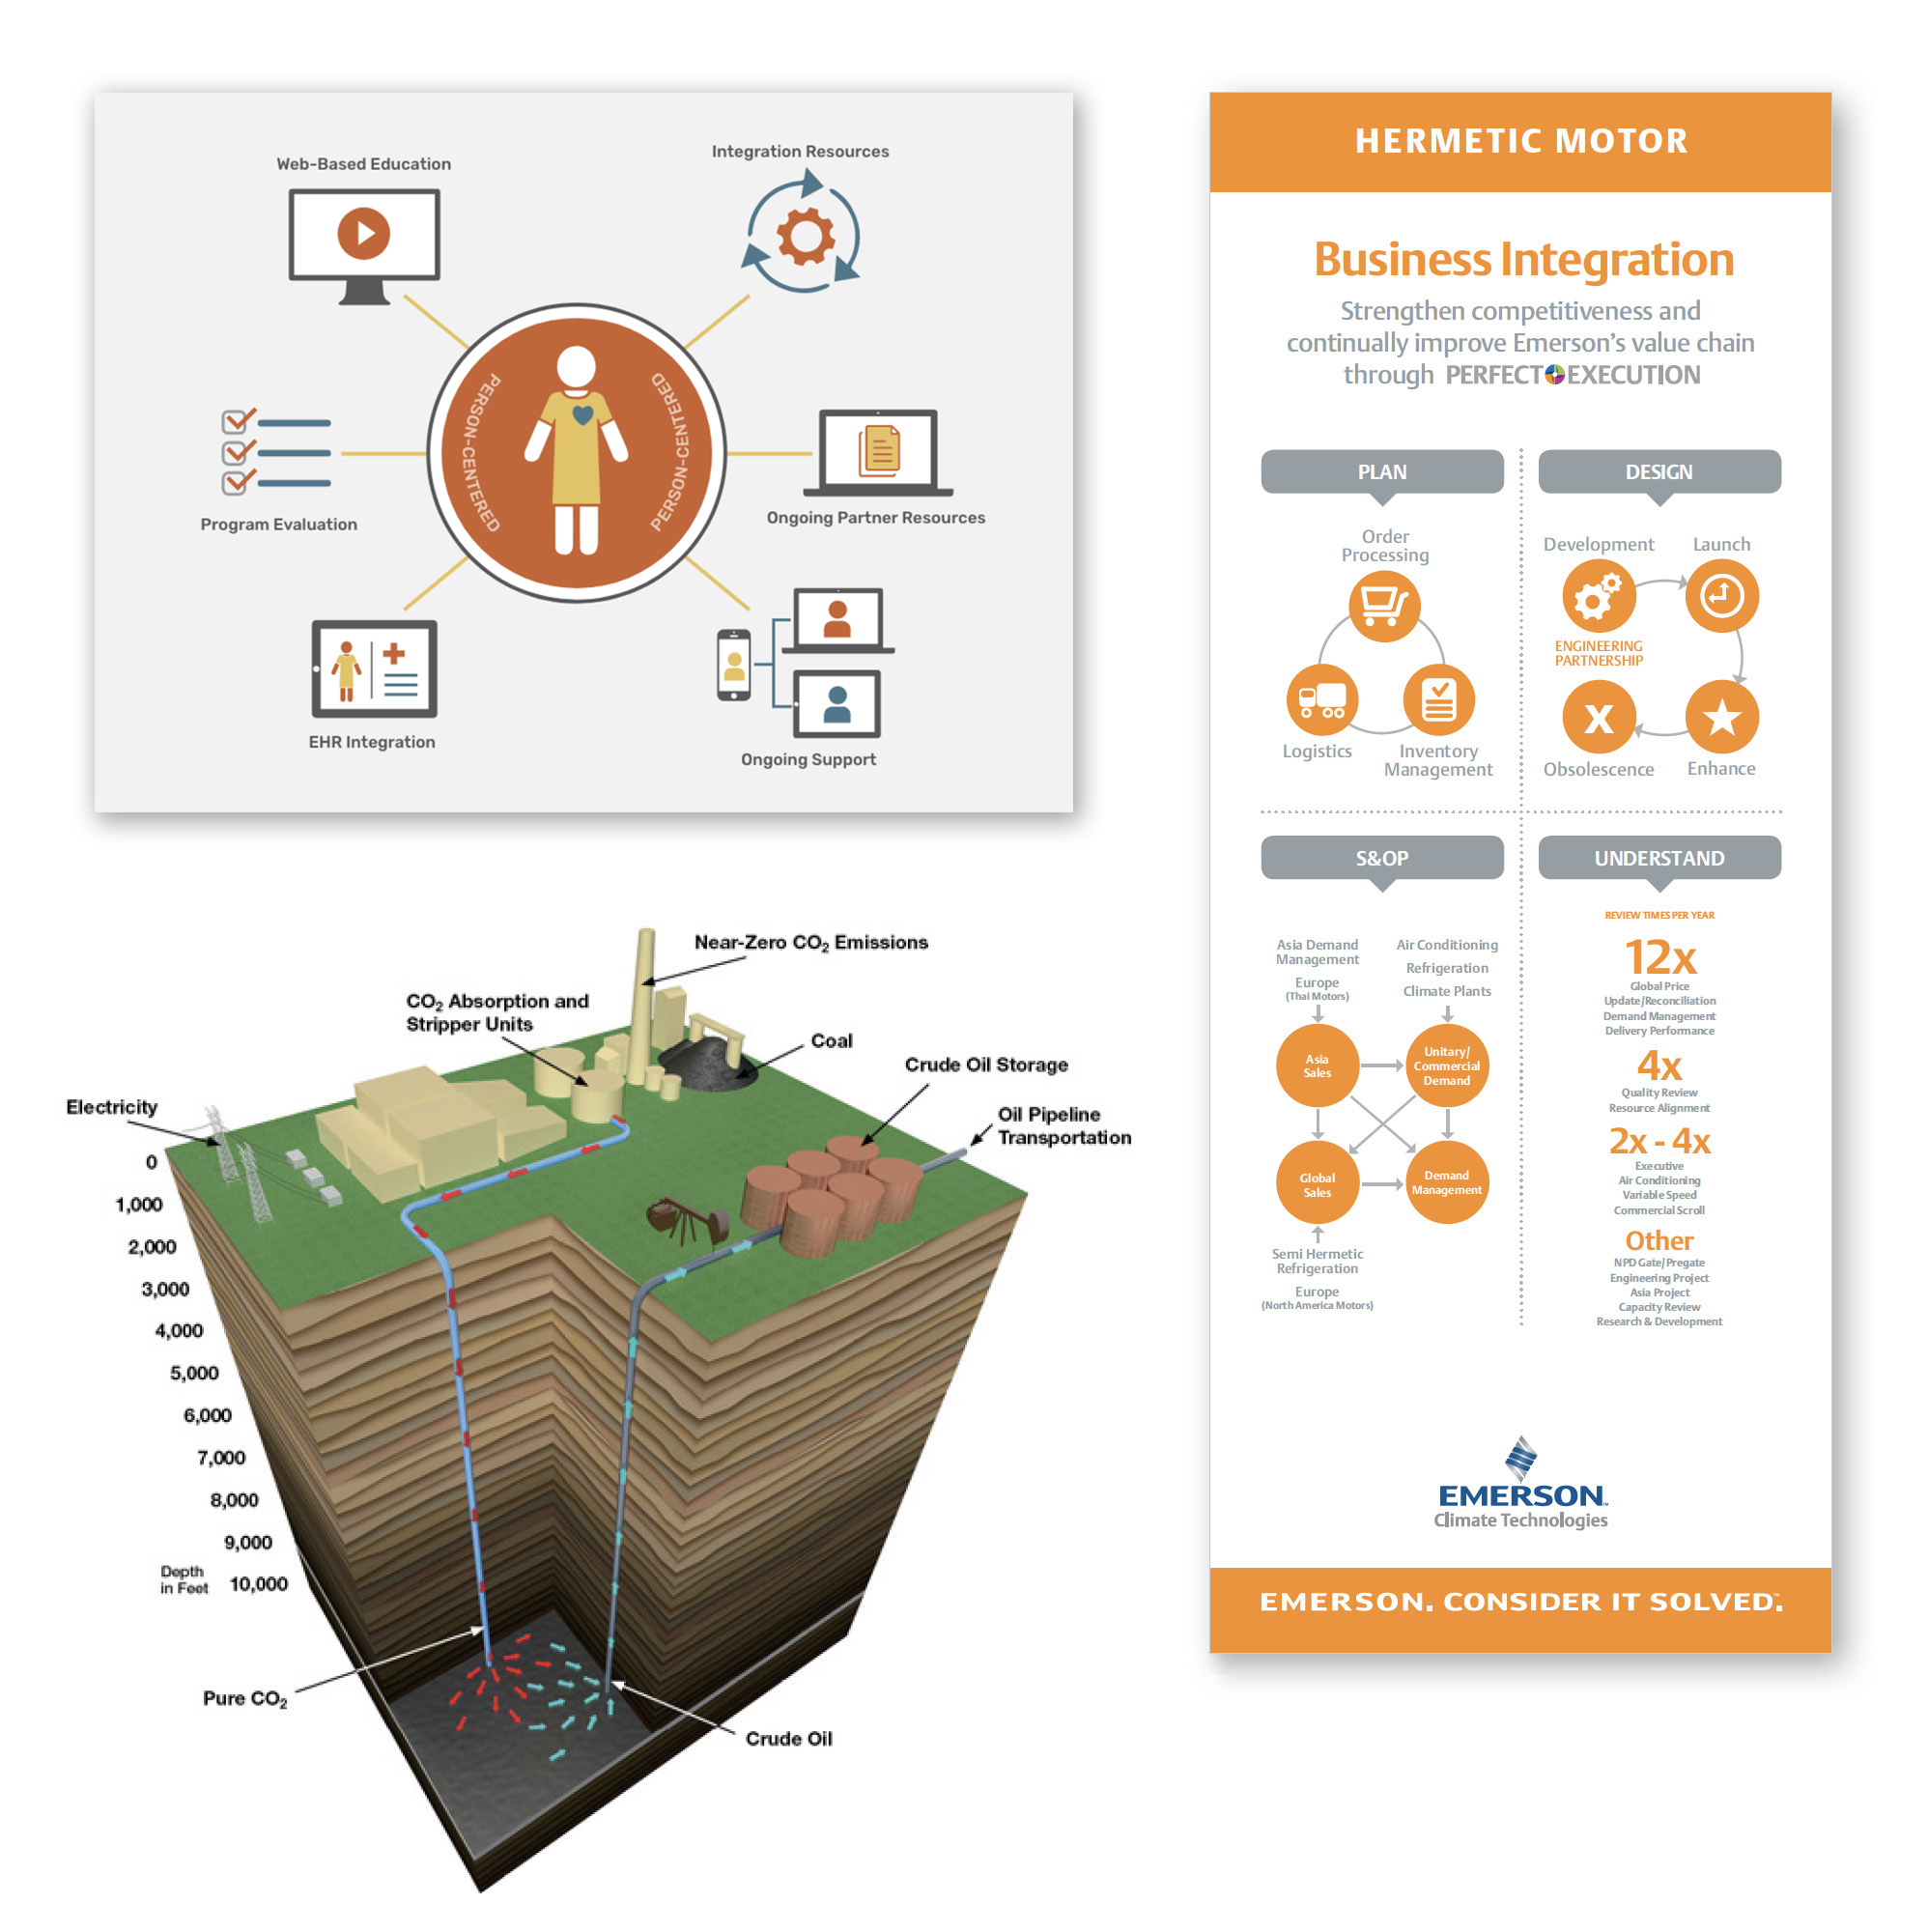
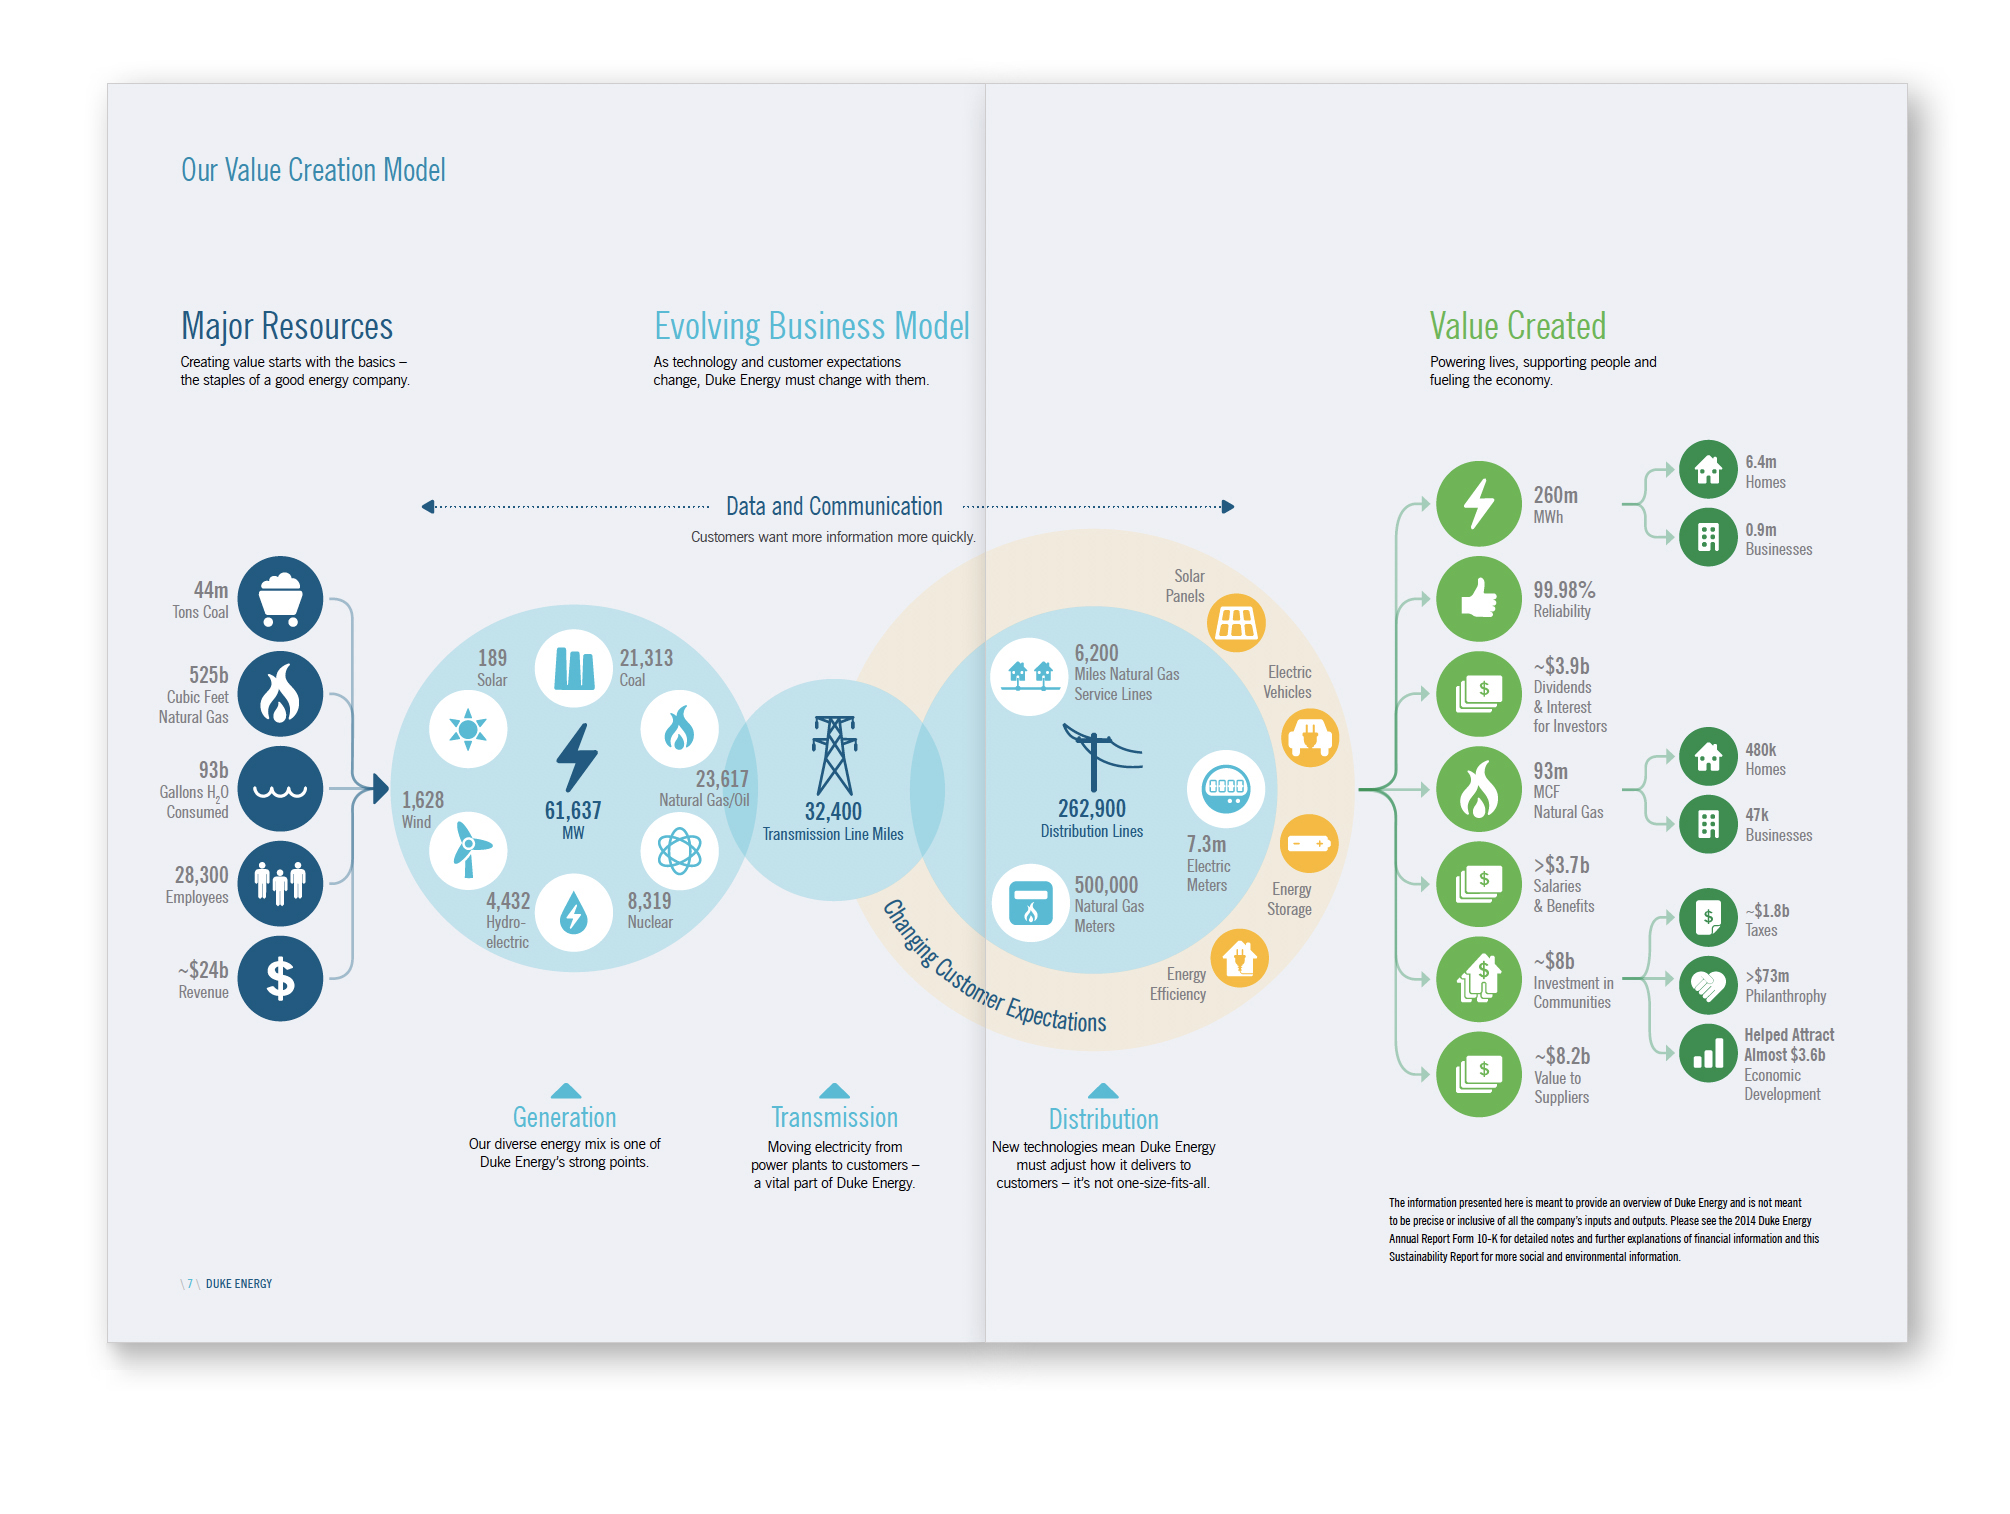
1. Mixed Charts Infographics
As its name implies, this infographic incorporates icons, charts, and graphs. It is the best option when you have many statistics, facts, and figures to communicate to your audience.
Mixed chart infographics pull together a variety of data into a clean, unique design that tells each client’s distinctive story.
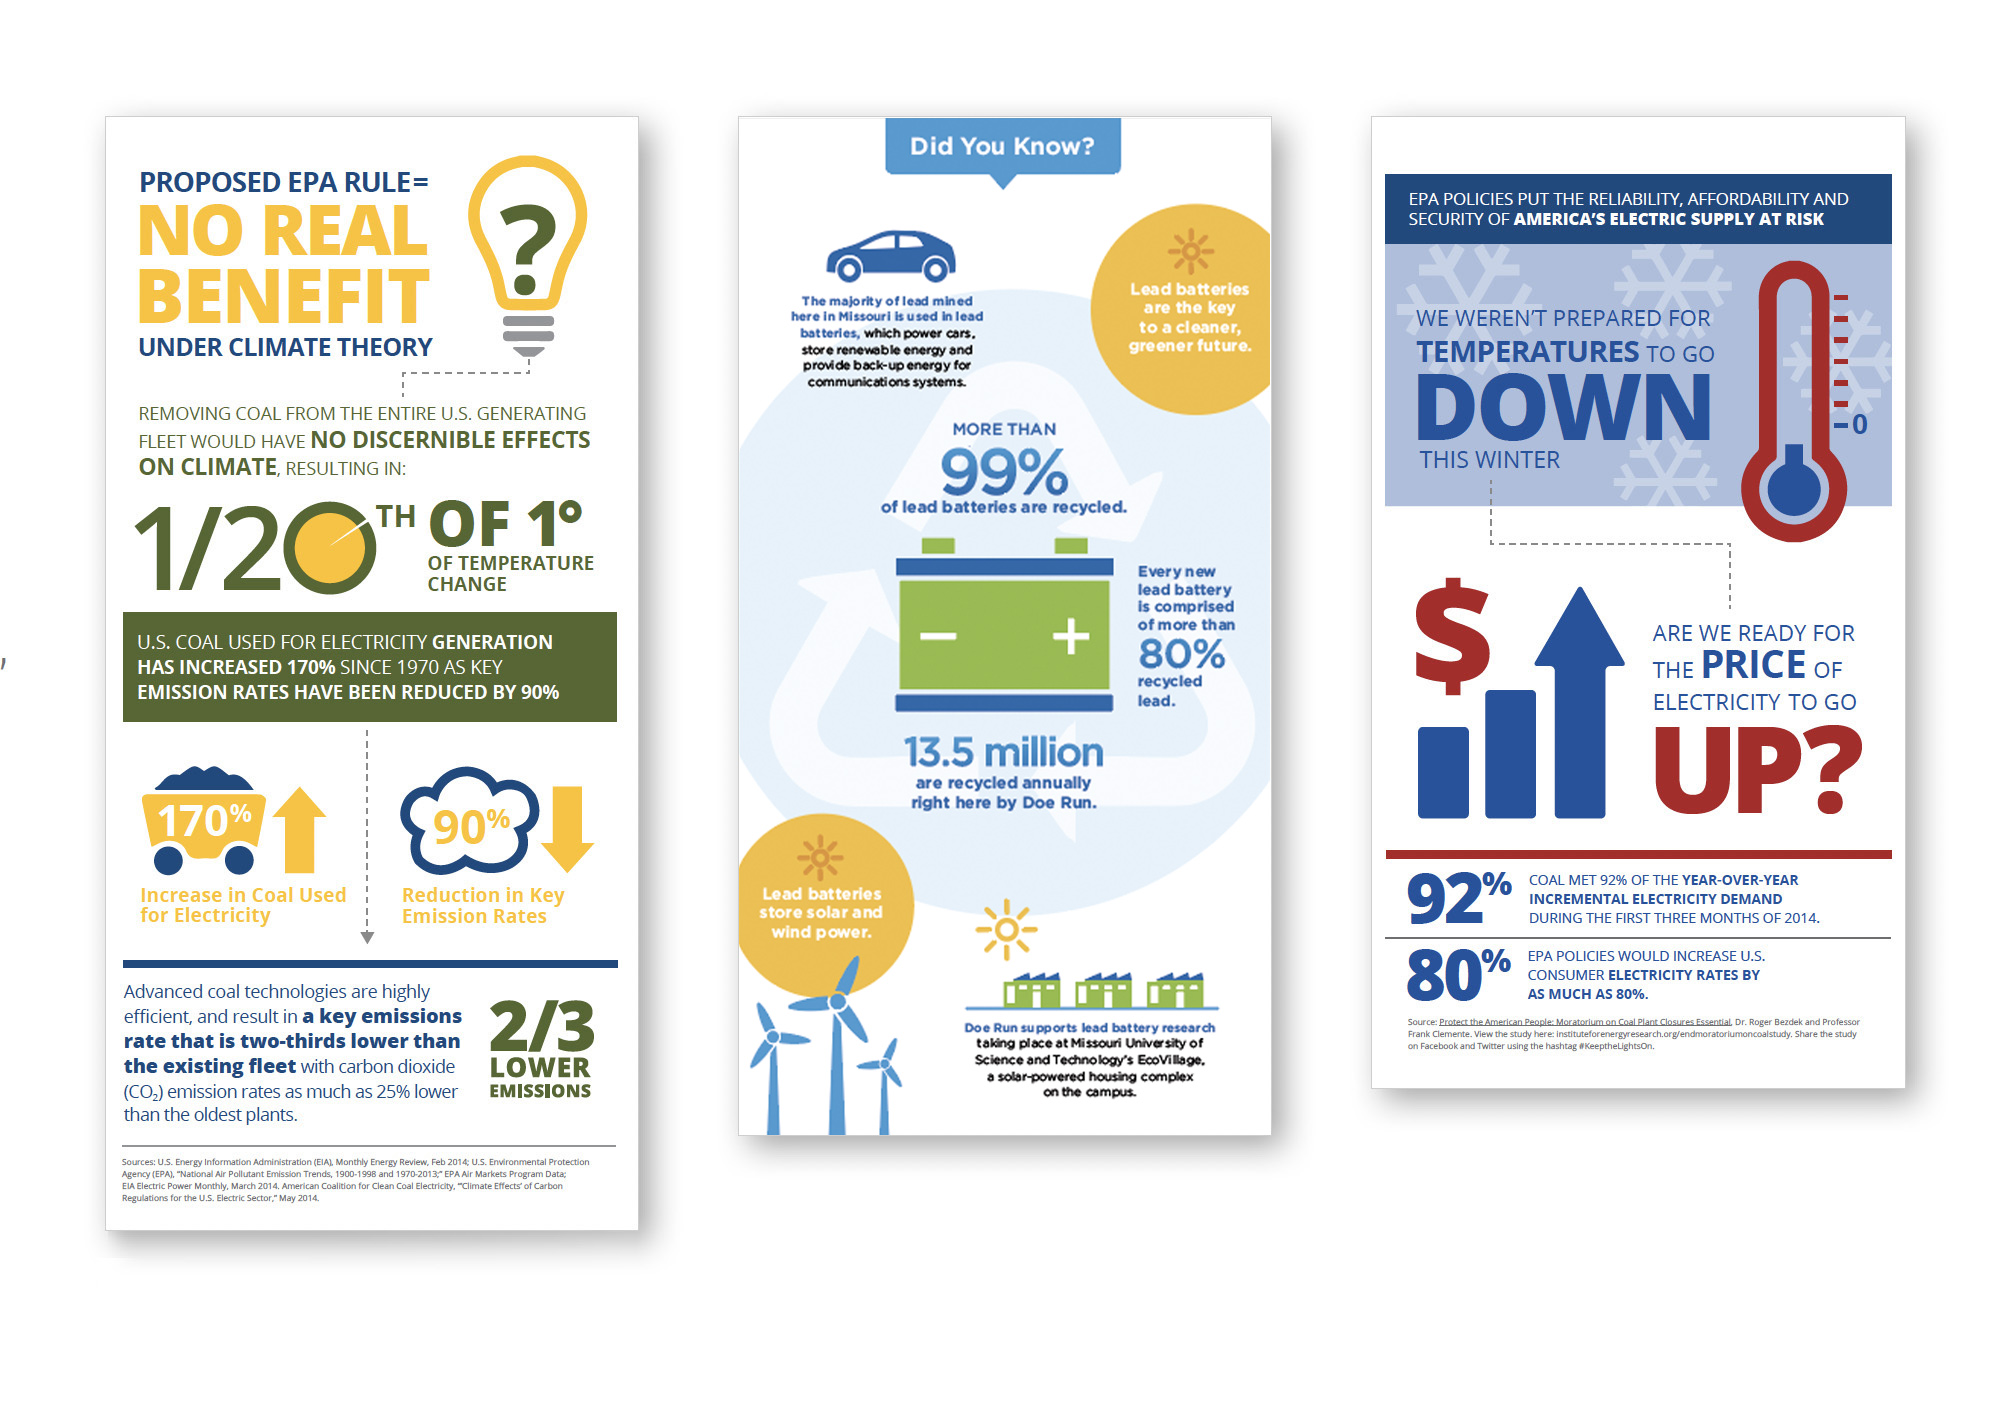
2. Informational Infographics
This long-form presentation is primarily text that supports a claim or perspective through steps, rules, or reasons.
This type of infographic can be enhanced with an attractive color scheme and icons to drive the message home.
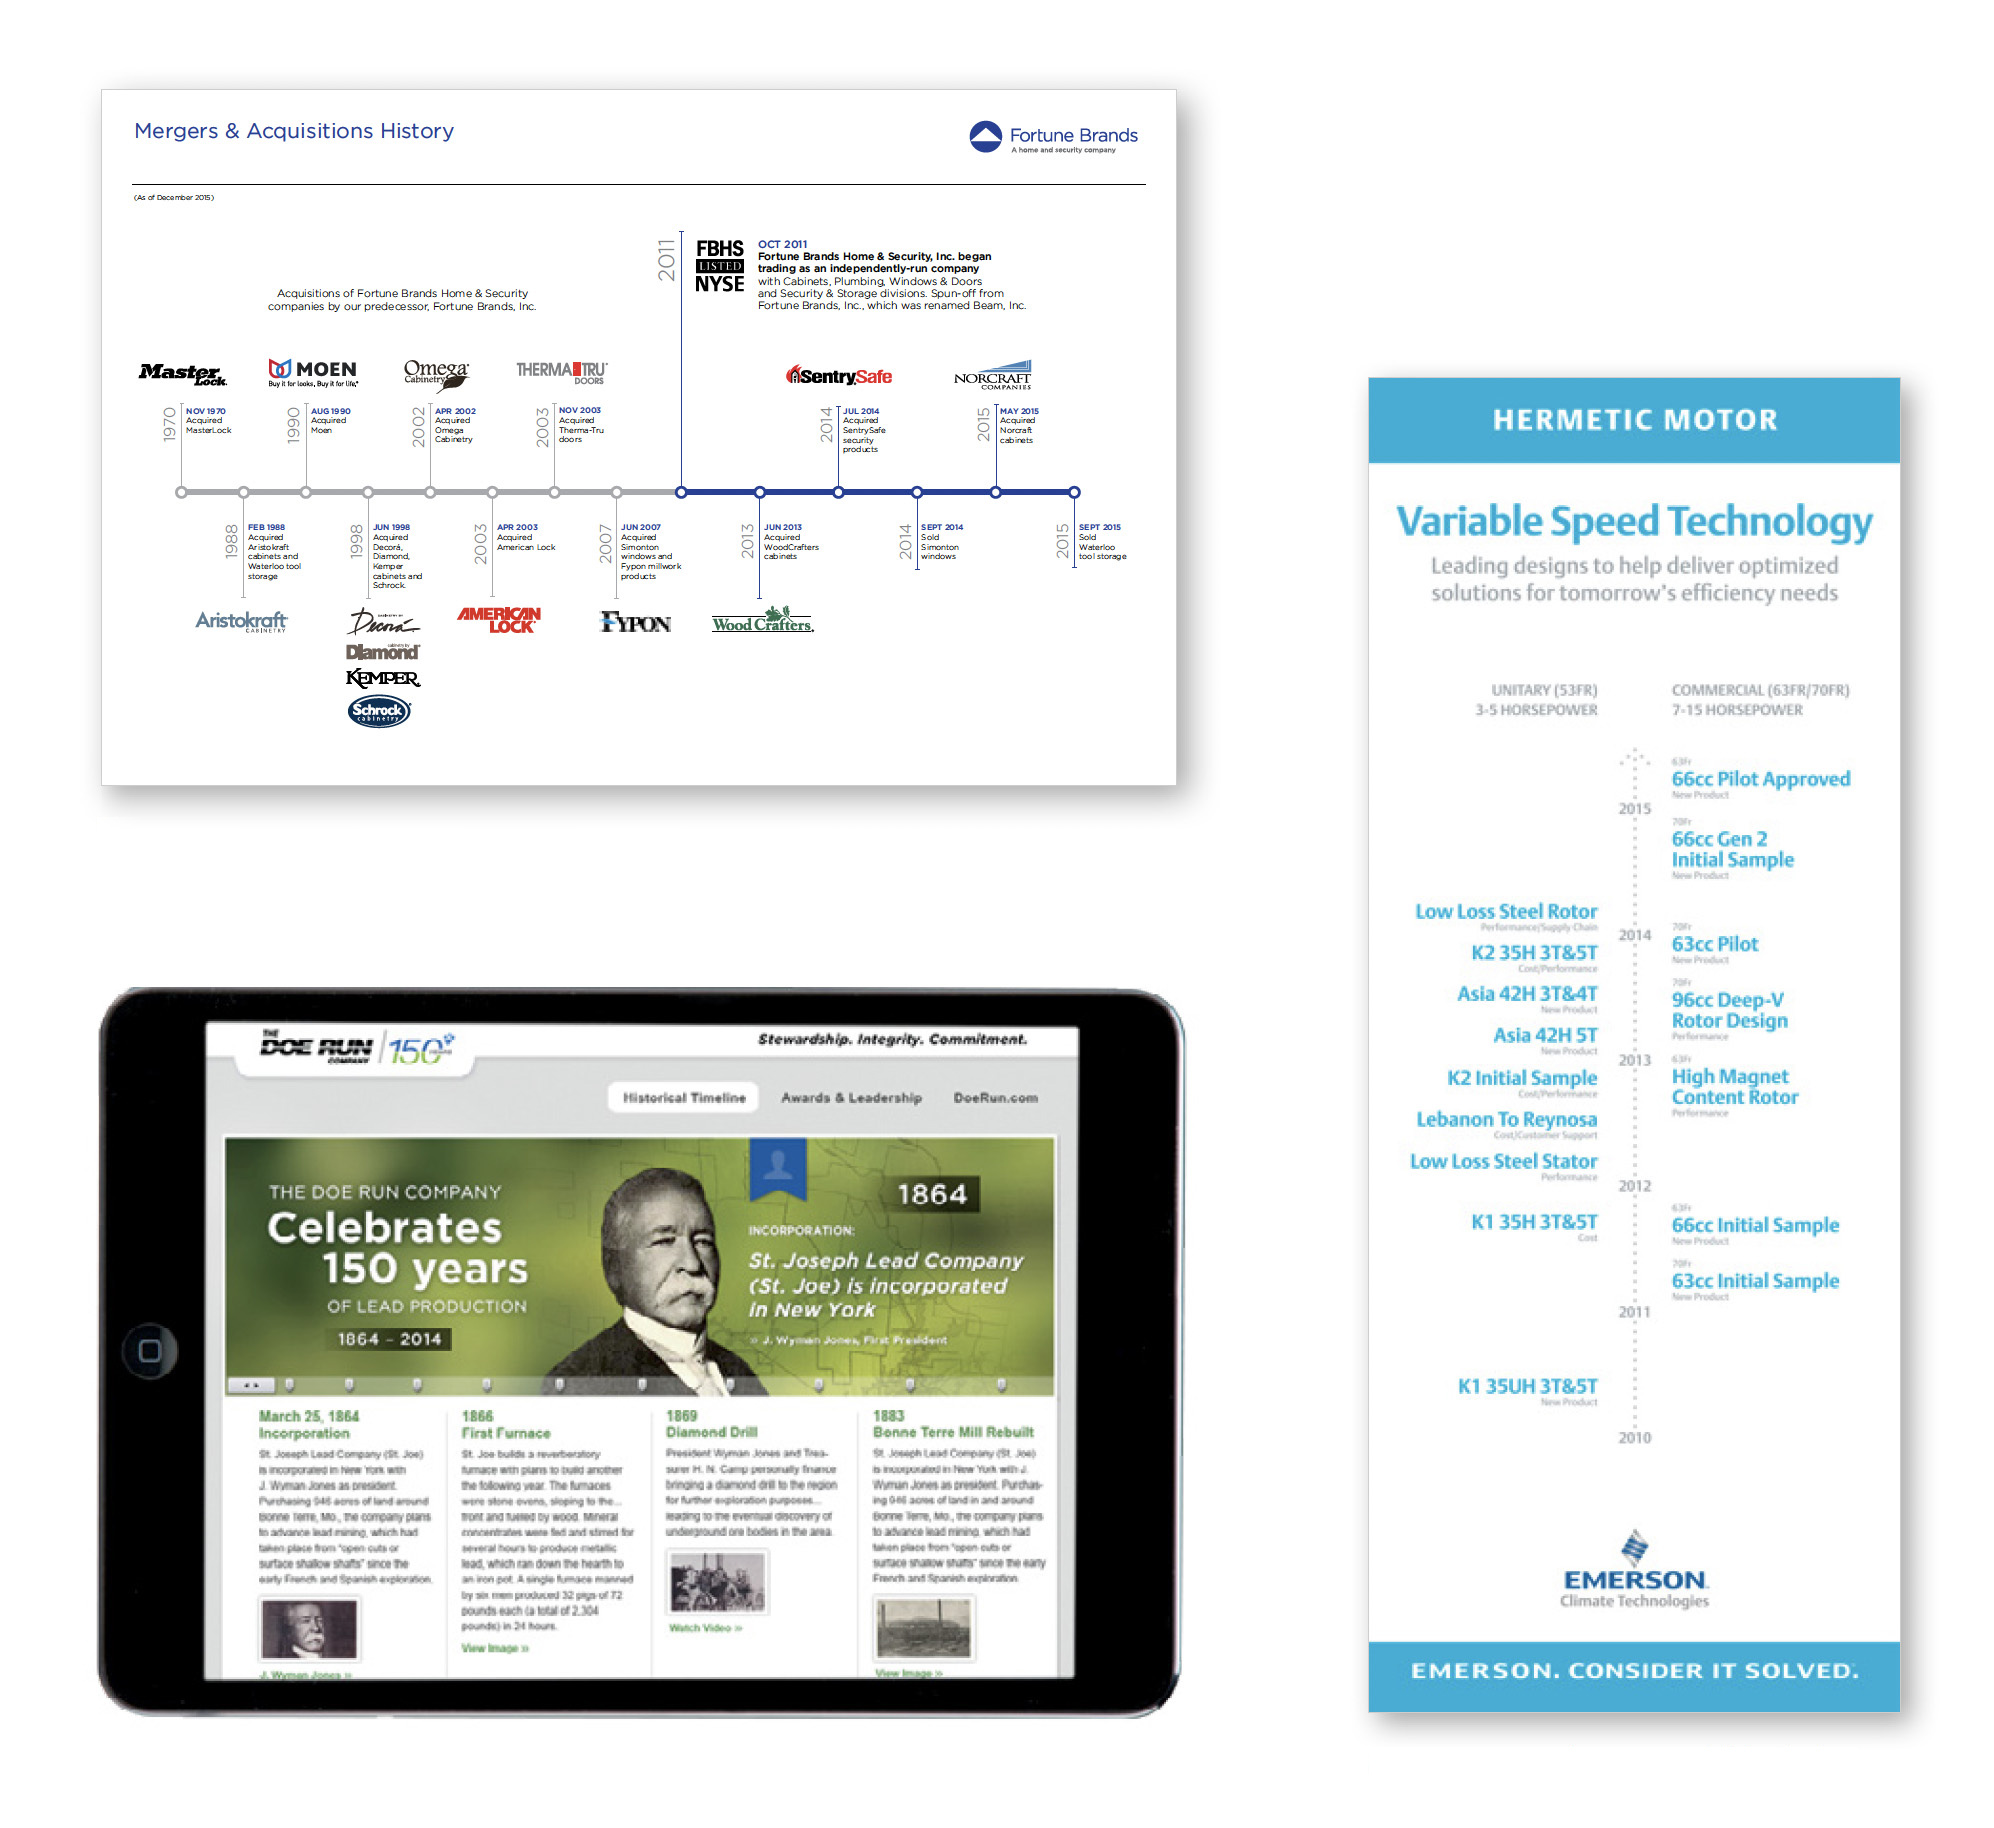
3. Timeline Infographics
Timelines succinctly capture a story that has evolved. They effectively communicate everything from brand stories to the historical development of a trend, person or product.
Timelines are most effective when they incorporate many data points accompanied by images, icons, and other graphic elements.
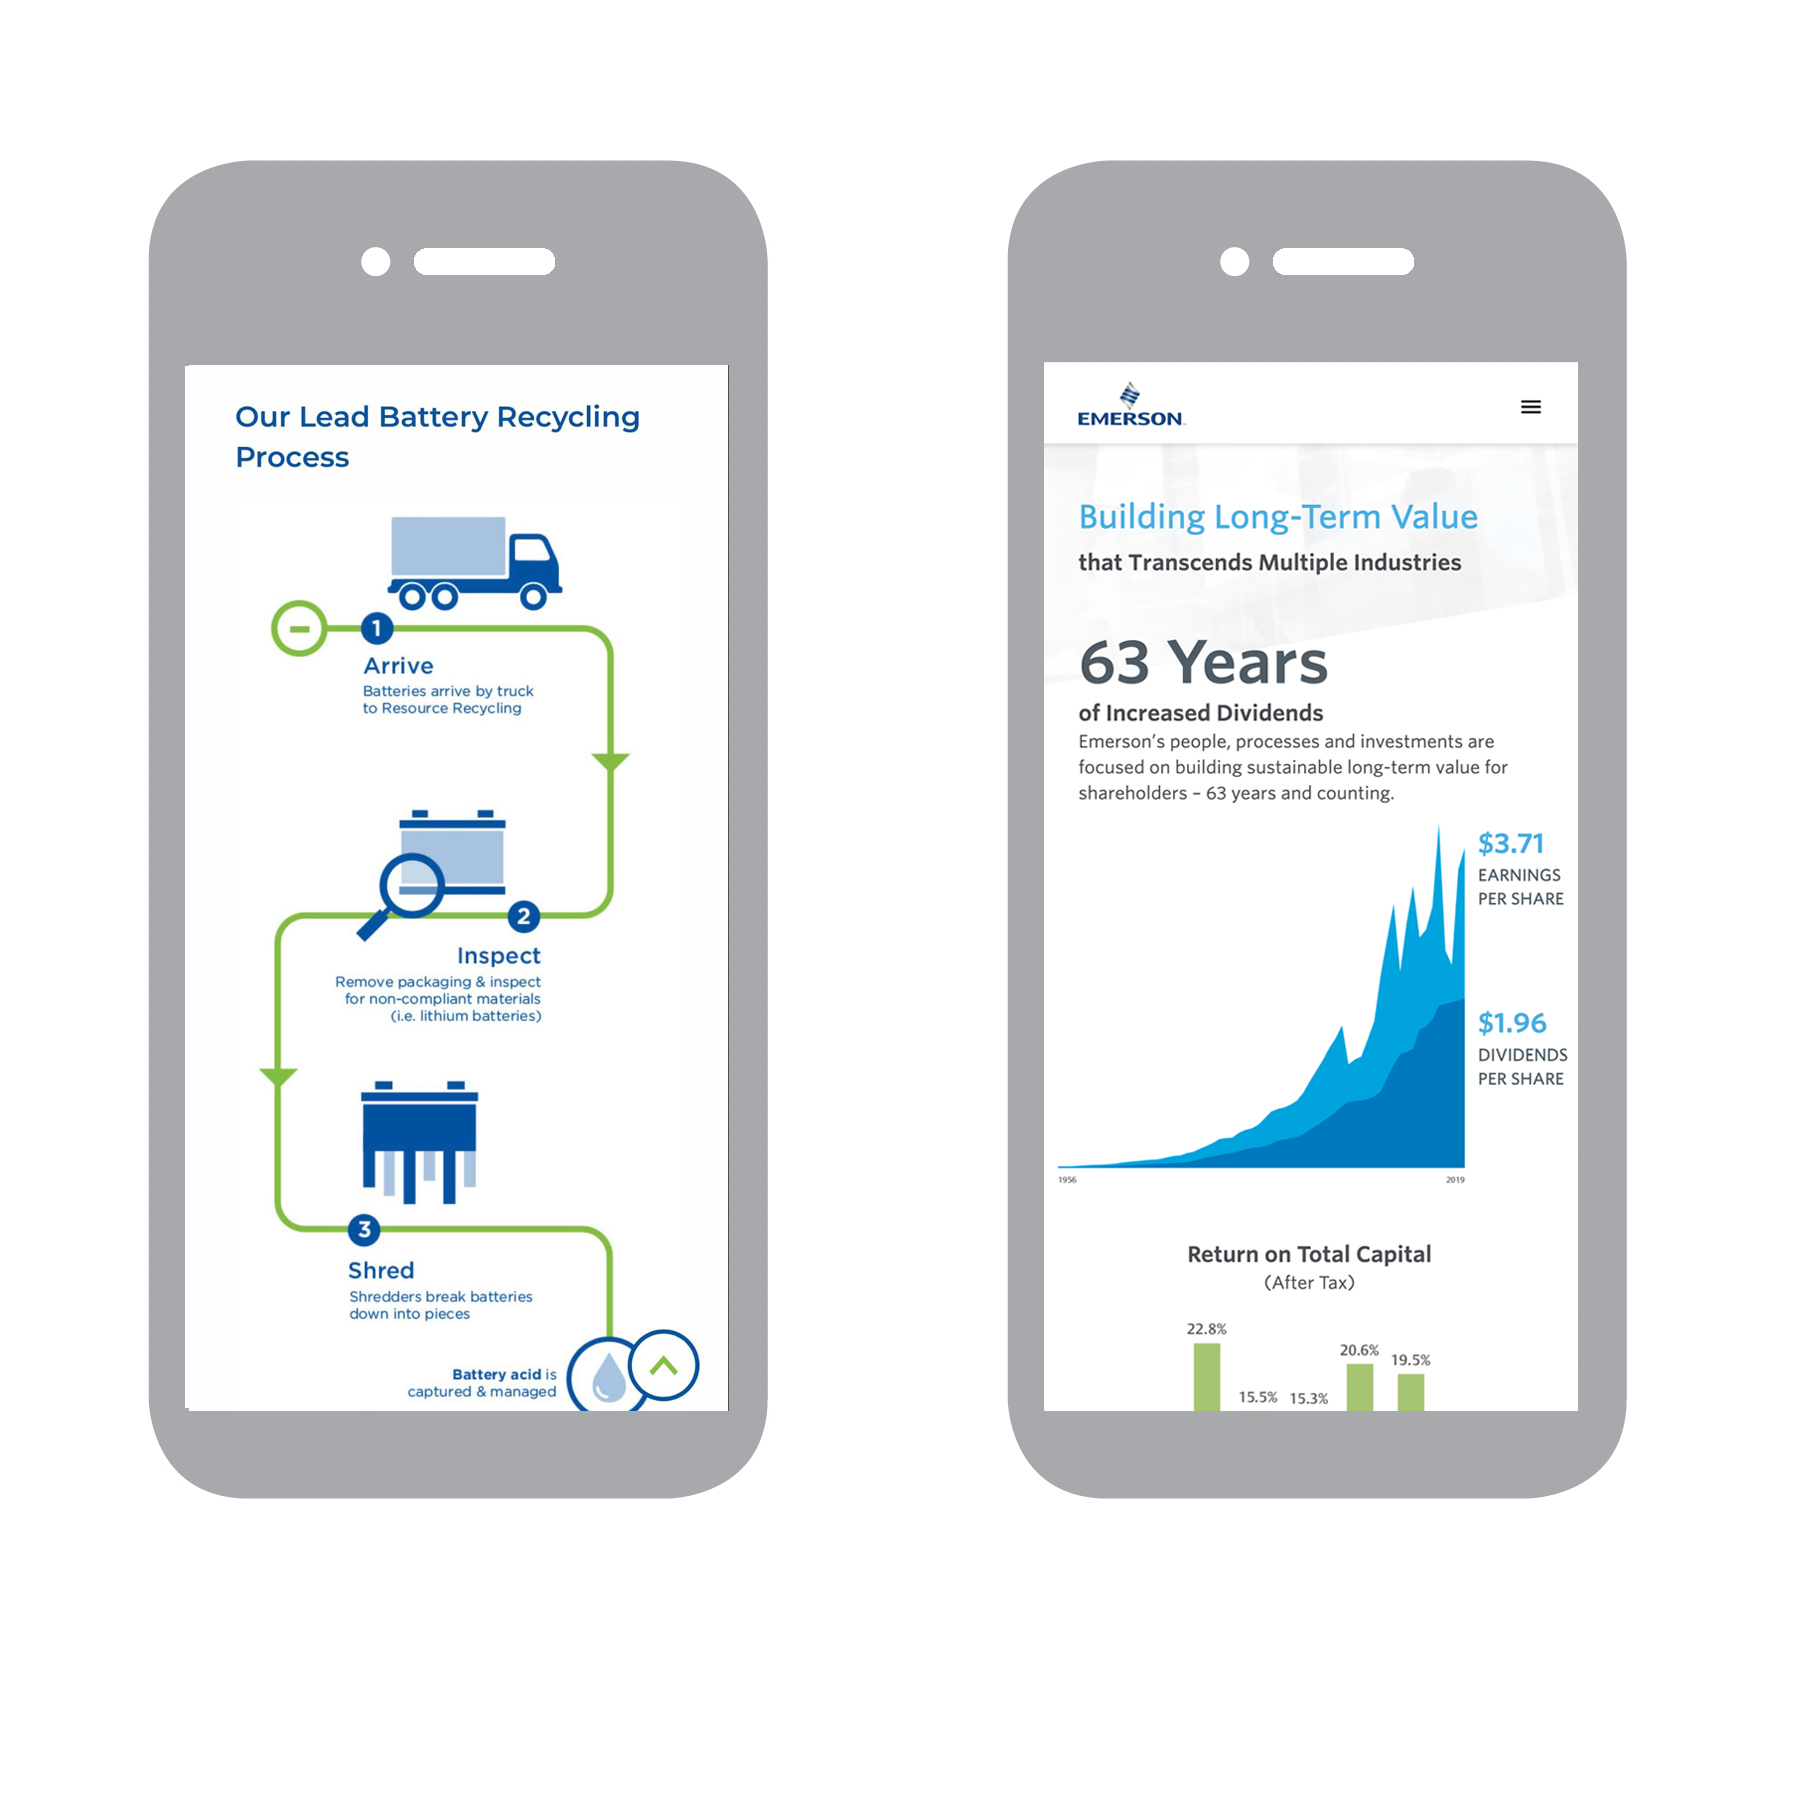
4. Flow Chart Infographics
This infographic summarizes the steps involved in creating a product or describing a process chain. It helps your audience visualize a concrete but complex series of instructions or information.
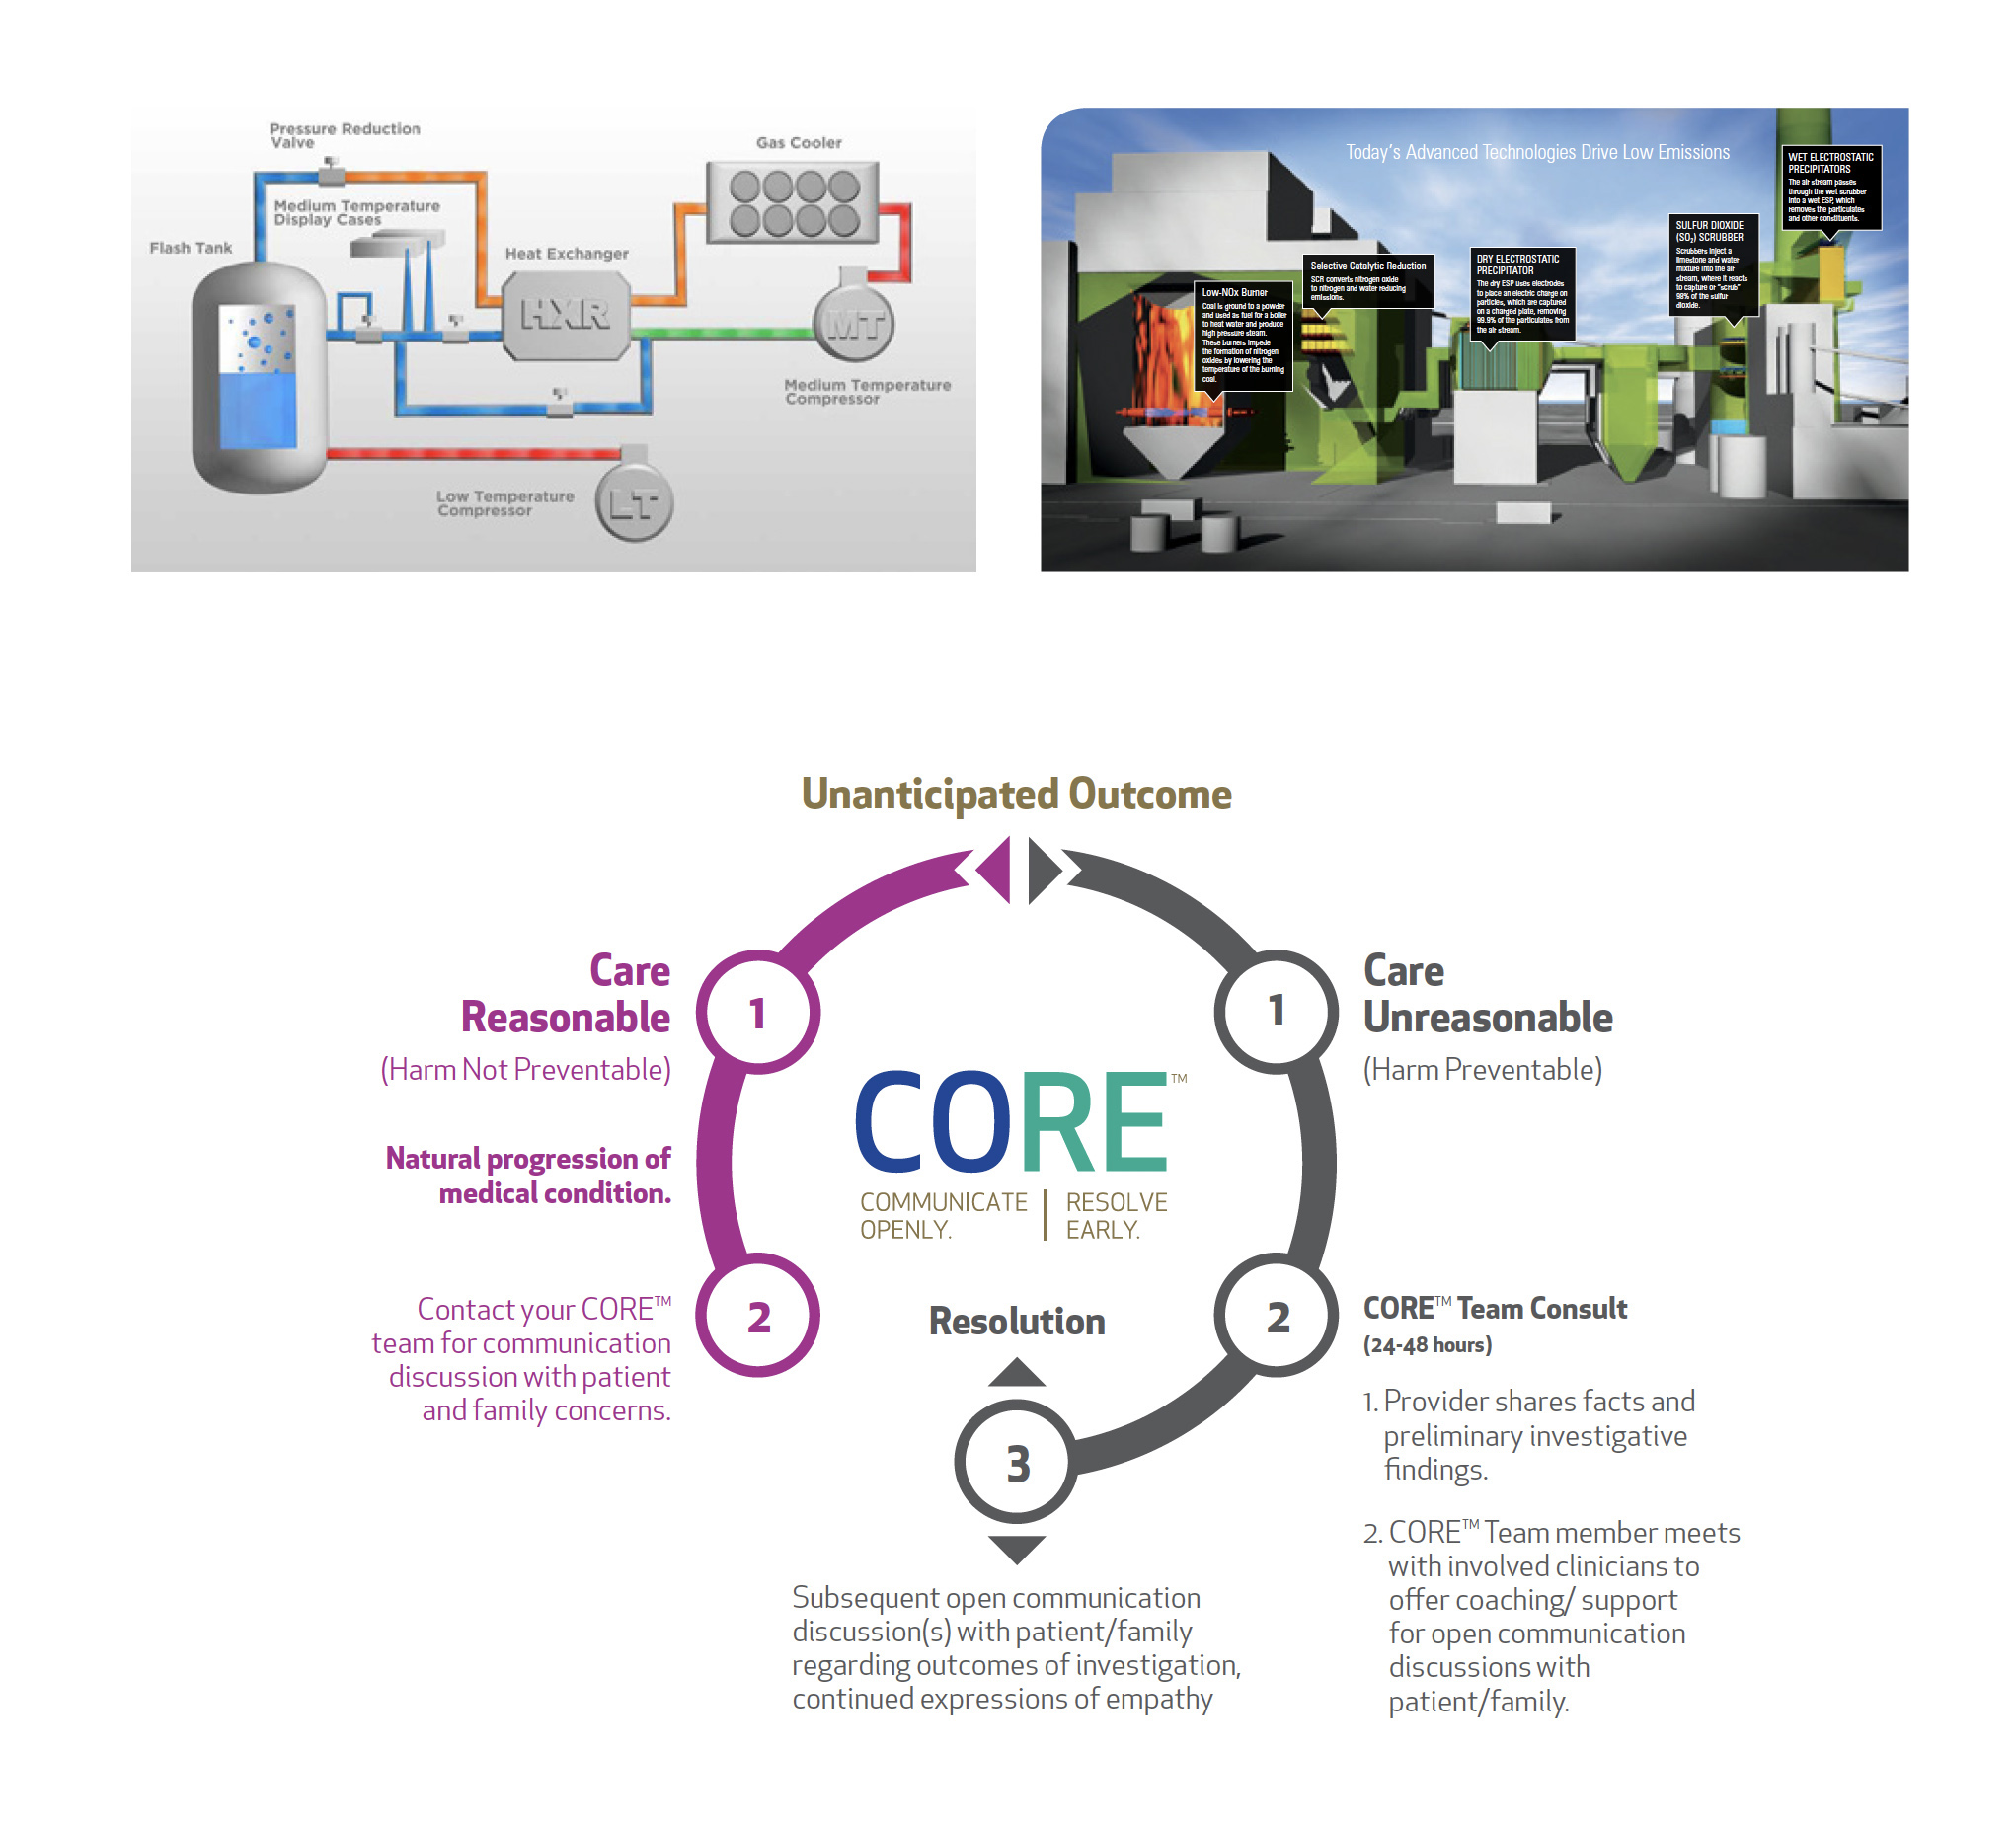
5. Process Infographics
This visual format is similar to a flow chart, but it captures an abstract process — particularly a decision-making process. This is commonly referred to as a decision tree.
6. Comparison Infographics
Infographics are commonly used for making comparisons between two products, people, ideas, objects, events, or places.
It can compare items side by side, or reveal the similarities, differences, and relative advantages between the two.
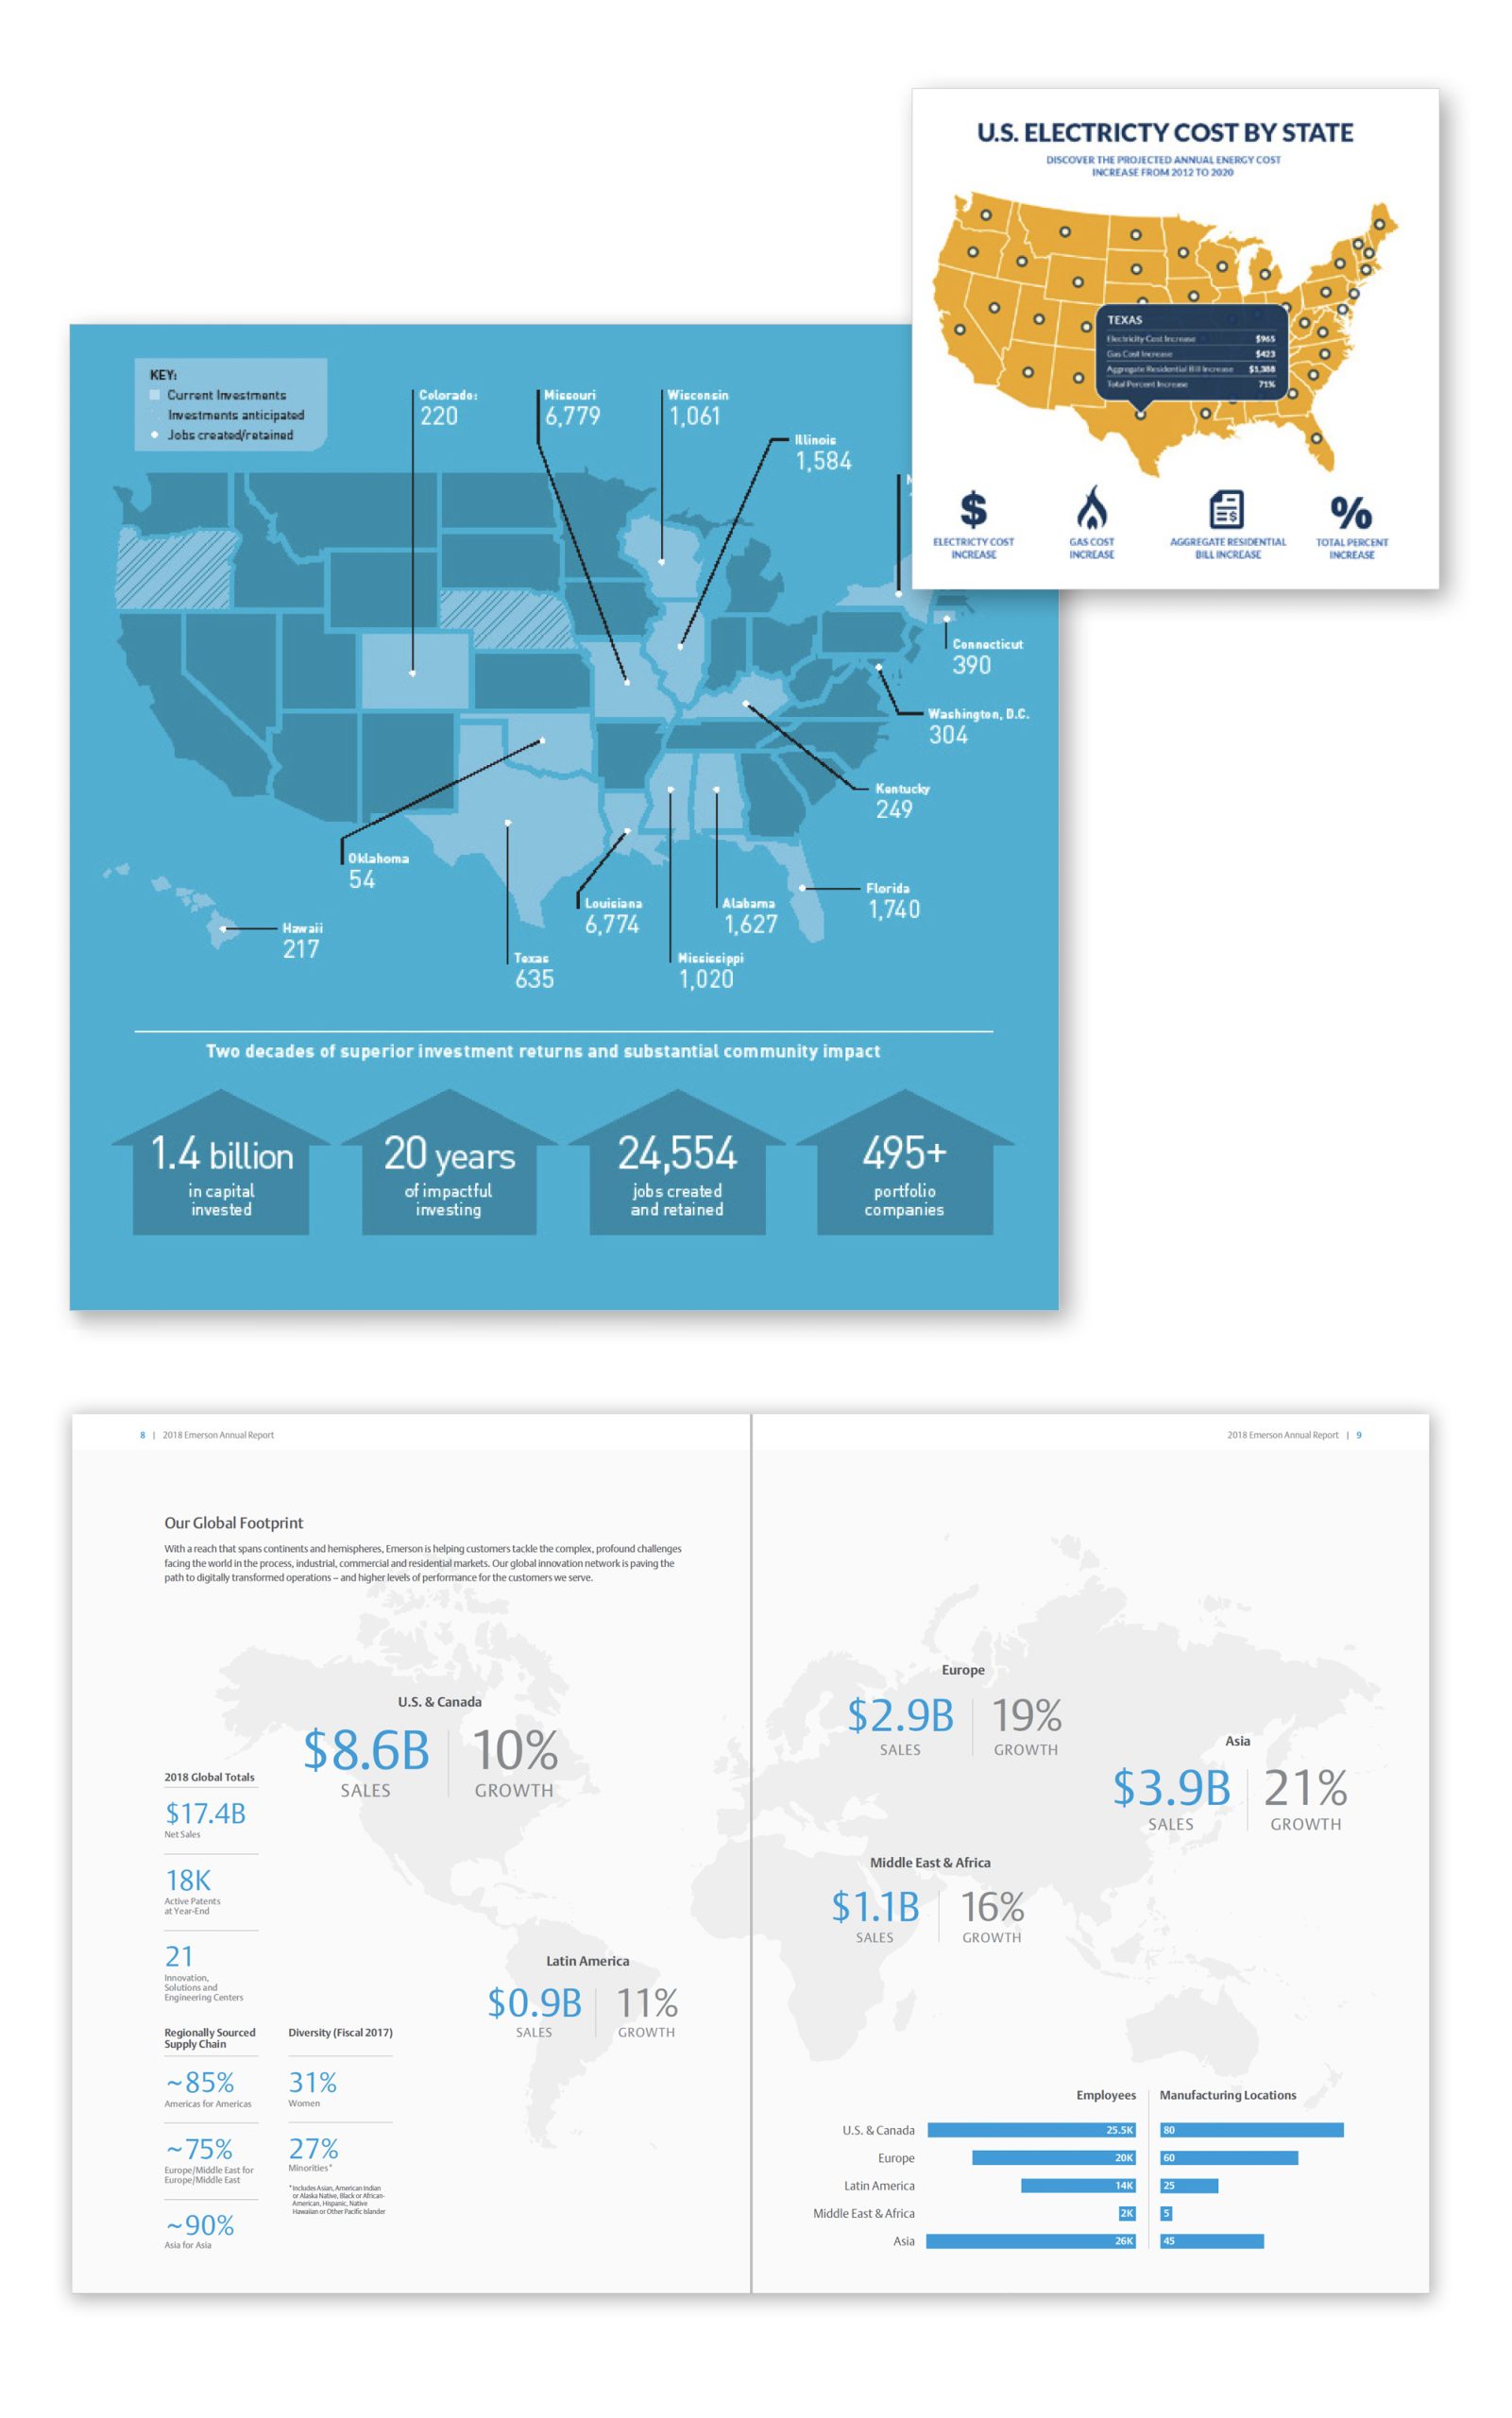
7. Location Infographics
Use a location infographic to visually communicate trends across a local, national, or global region. This type of infographic is often visualized in the form of a map. It is ideal for comparing regional and global statistics on a relevant subject that readers care about.
8. Photographic Infographics
A photographic infographic combines a photograph with elements such as simple line charts, icons, or text. The infographic is aesthetically pleasing and catches the eye because of the way it creatively combines disparate visual forms.

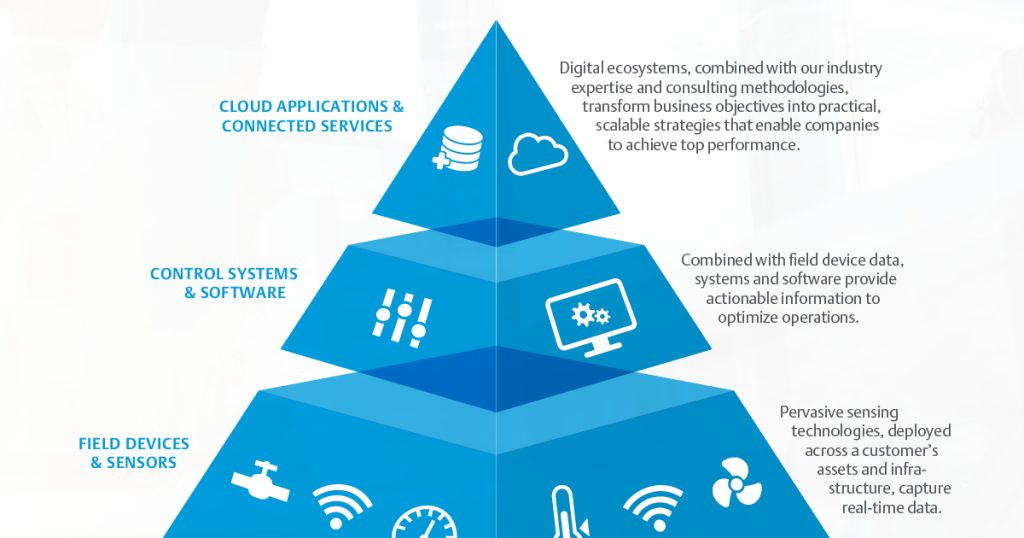
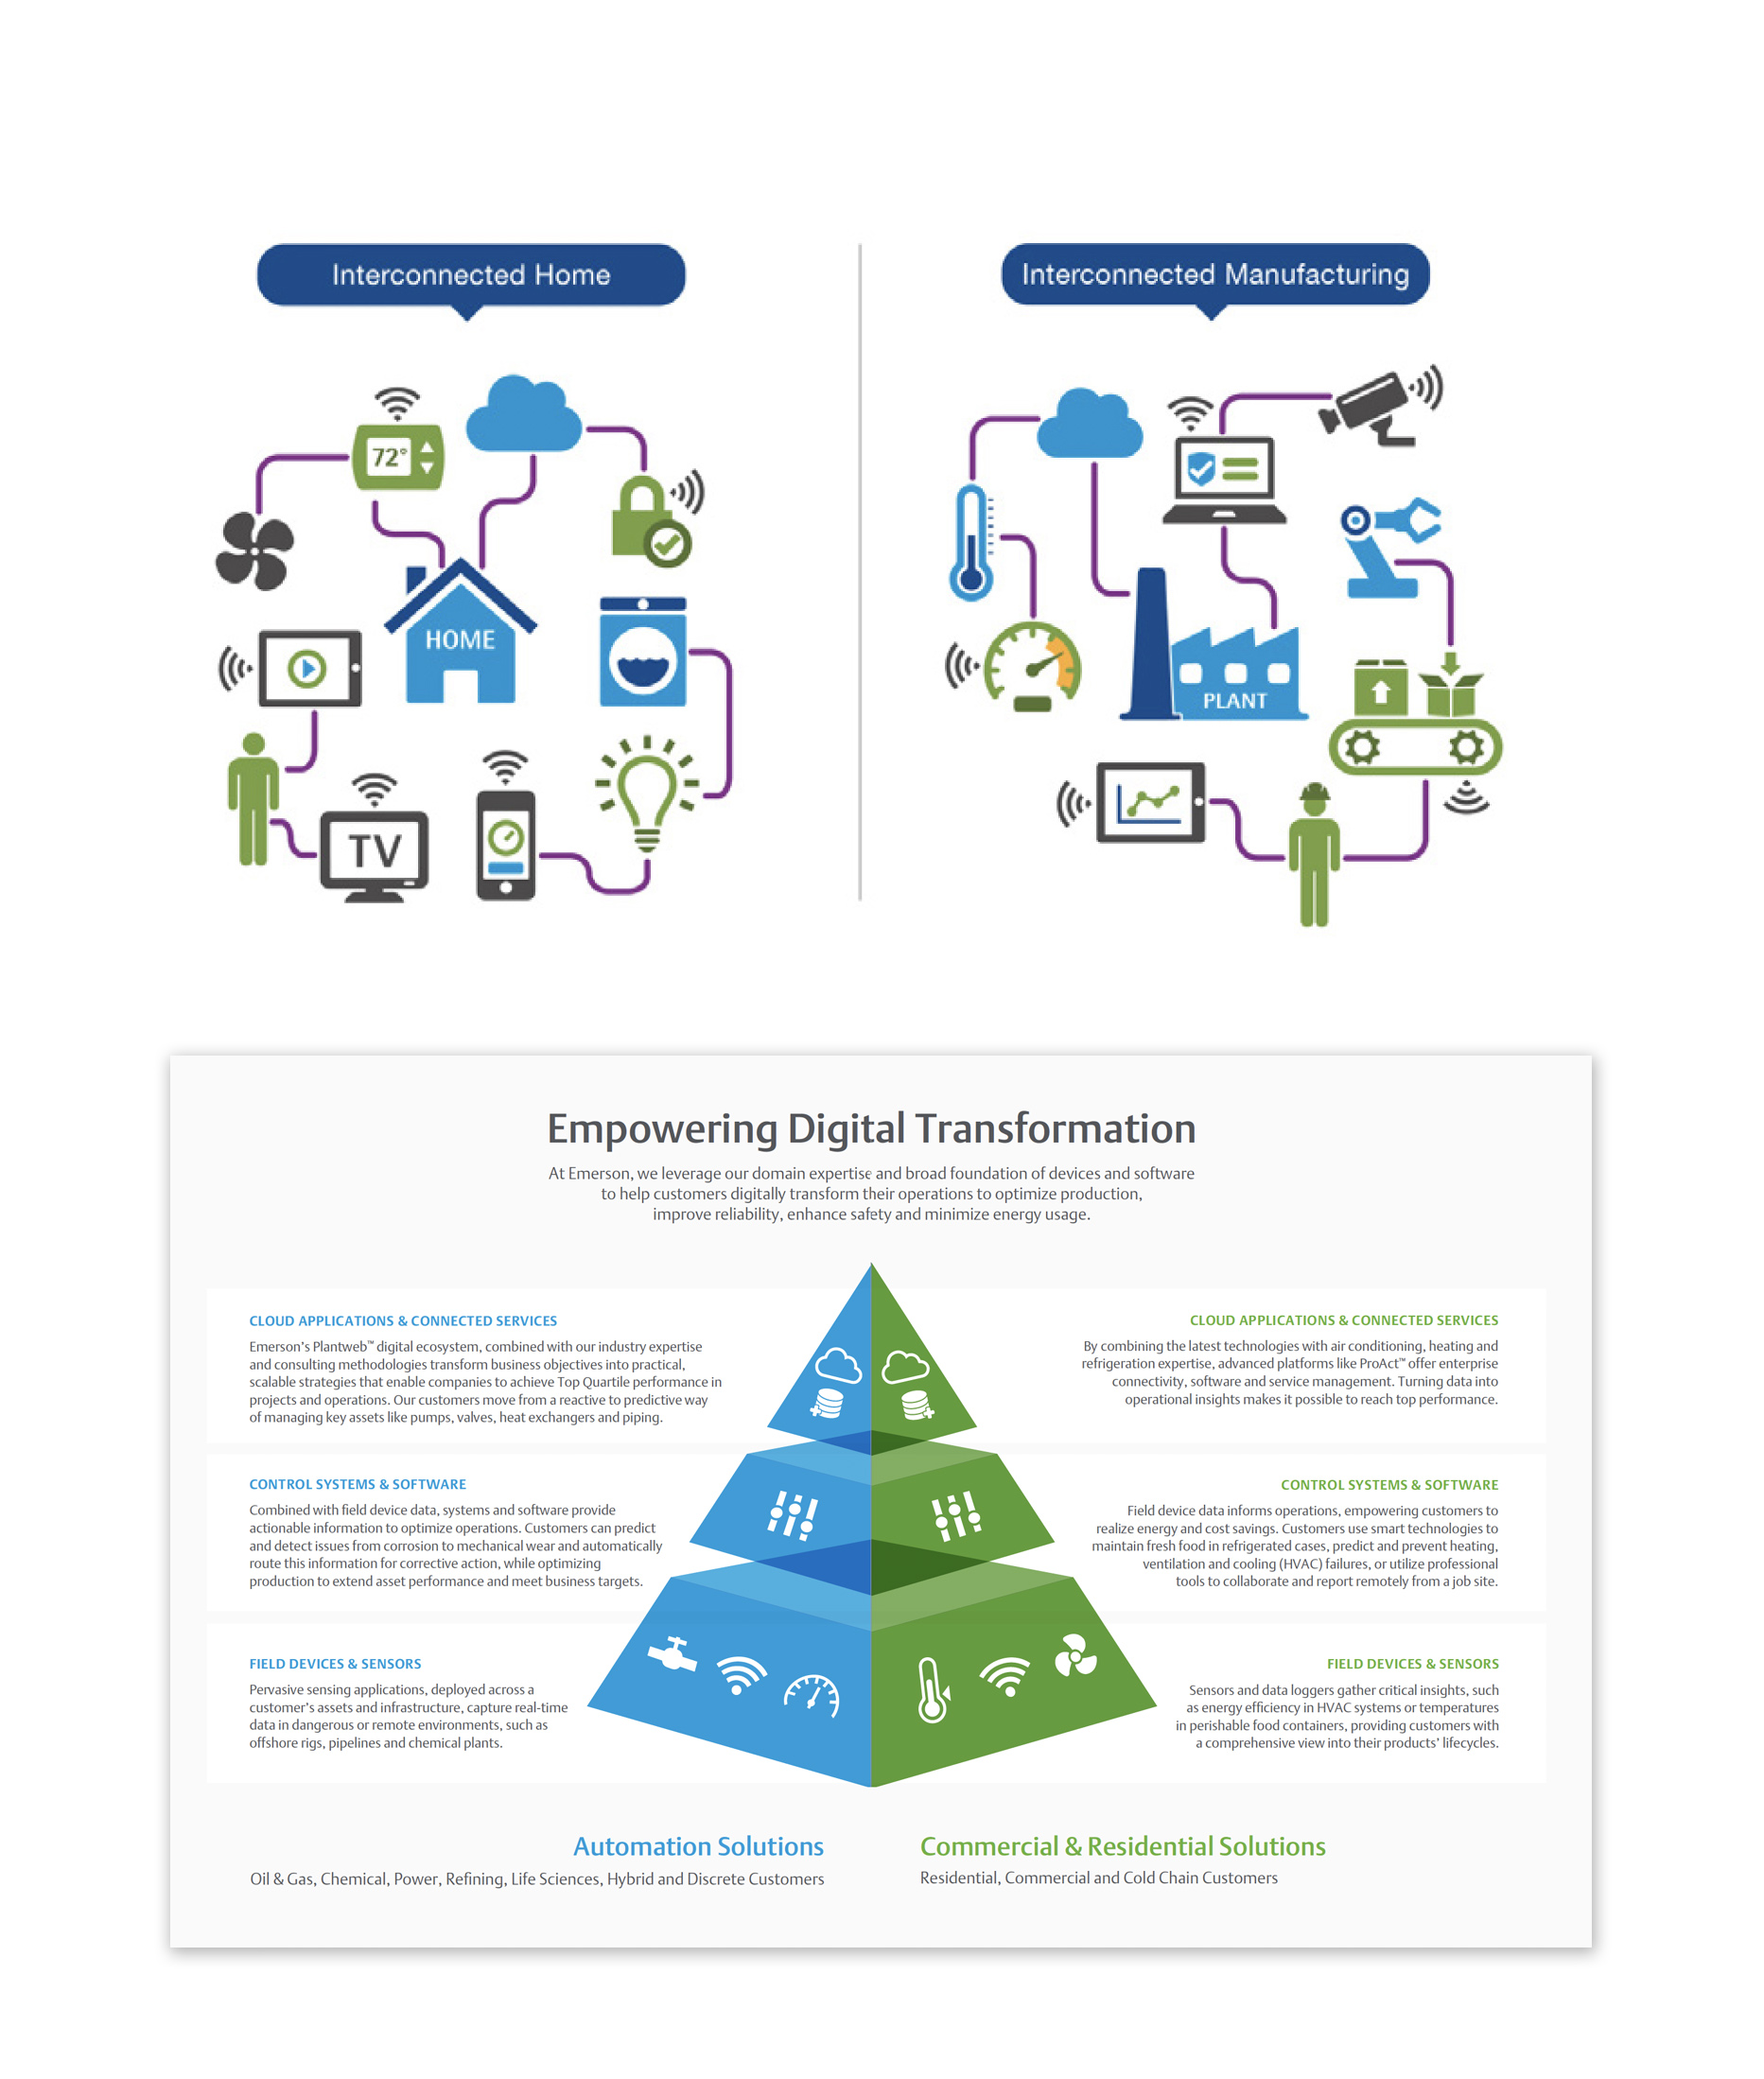
9. Hierarchical Infographics
This graphic organizes information according to levels – whether it be level of importance, level of difficulty, or income level, for example.
Hierarchical infographics are most commonly seen in the shape of a pyramid or an organizational chart. Their key function is comparing levels and demonstrating the relationship between them.
10. Interactive Infographics
Interactive and responsive infographics are a great way to maximize audience engagement and participation. They are ideal for sharing across various digital platforms and devices.
OBATA designers are infographic design experts
Visual storytelling through infographics can help your business reach its target audience in more meaningful ways.
Over the years OBATA designers have created hundreds of infographics. Some of the most common uses were for annual reports, sustainability and ESG reports, marketing, and other visual storytelling purposes.
We have designed infographics for print and digital marketing. We have also created animated infographics for videos, websites, and social media.
As infographic designers, we visualize data and craft infographics to:
- Help you leverage the power of your data
- Simplify and deliver your data in a memorable and compelling way
- Maximize understanding and inspire meaningful audience action
- Improve your brand awareness, marketing and business development